
October 13, 2014
London, England
[Editor’s note: Tim Price, London-based wealth manager, is filling in for Simon today.]
“When sorrows come,” wrote Shakespeare, “they come not single spies, but in battalions.”
True. And Jeremy Warner for the Daily Telegraph identifies ten such sorrows in his ‘ten biggest threats to the global economy’:
1) Geopolitical risk;
2) The threat of oil and gas price spikes;
3) A hard landing in China;
4) Normalization of monetary policy in the Anglo-Saxon economies;
5) Euro zone deflation;
6) ‘Secular stagnation’;
7) The size of the debt overhang;
8) Complacent markets;
9) House price bubbles;
10) Ageing populations.
We’ll start with point #7: the size of the debt overhang.
Since this was never addressed in the immediate aftermath of the Global Financial Crisis, it’s hardly a surprise to see the poison of debt continue to drip onto all things financial.
ALL German government paper out to three years, for example, now offers a negative yield. Investors must pay rent to the German government in order to buy its debt.
This has implications. And much of the rest of Warner’s ‘threats’ are inextricably linked to this debt overhang.
Point #8: Complacent markets? Check. (Though stocks have lost a lot of their nerve…)
Point #9: House price bubbles? Check. Since the monetary policy response to having too much debt in the system has been to slash rates and keep them at multi-century lows, it’s hardly a surprise to see property prices in a bubble. Again.
Point #5: Euro zone deflation? Check. This is less of a threat to solvent consumers, but deadly for indebted governments.
Point #4: Pending normalization of monetary policy in the UK and US? Check.
This threatens the integrity of the credit markets. And it’s worth asking whether central banks could possibly afford to let interest rates rise and risk bankrupting their governments.
We saw one particularly eye-catching chart last week, via Grant Williams, comparing the leverage ratios of major US financial institutions over recent years (shown below).
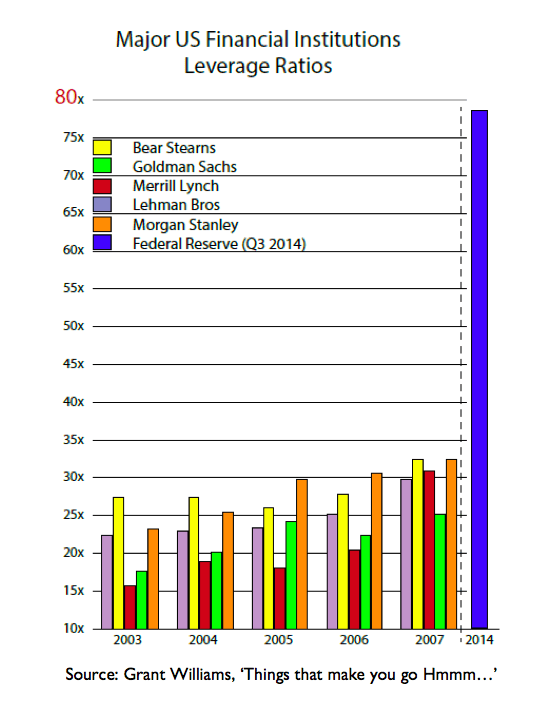
The Fed’s leverage ratio (total assets to capital) now stands at just under 80x. That compares with Lehman Brothers’ leverage ratio, just before it went bankrupt, of just under 30x.
Sometimes a picture really does paint a thousand words.
And this, again, brings us back to the defining problem of our time: too much debt in the system.
In a recent interview with Jim Grant, Sprott Global questioned the famed interest rate observer about the likely outlook for bonds. Grant responds:
“I’m not sure what a bear market would look like, but I think that it would be characterized at first by a lot of people rushing through a very narrow gate. ”
Grant was also asked if it was possible for the Fed to lose control of the bond market:
“Absolutely, it could. The Fed does not control events for the most part. Events certainly will end up controlling the Fed. To answer your question – yeah. I think the Fed can and will lose control of the bond market.”
As we have written on innumerable prior occasions, we wholeheartedly agree. What will drive pretty much all asset markets over the near, medium and longer term is almost entirely down to how credit markets behave.
The fundamentals (again, take one look at the chart) are utterly shocking, as are the implications.
And let us not confuse the prognosis by arguing over the diagnosis.
As Professor Antal Fekete writes in his Monetary Economics 101: The real bills doctrine of Adam Smith–
“Hyperinflation and hyper-deflation are just two different forms of the same phenomenon: credit collapse. Arguing which of the two forms will dominate is futile: it blurs the focus of inquiry and frustrates efforts to avoid disaster.”